6 Jun 2026
Mapping Cursor Speed Fluctuations Against Pot Size Decisions to Spot Concentration Lapses in Prolonged Virtual Ring Games
Online poker platforms record detailed logs that include cursor movements alongside betting actions, and analysts now examine how speed changes in those movements align with pot size choices during long cash game sessions. Data collection happens through client-side scripts that timestamp every mouse event while players navigate bet sliders and decision buttons, creating datasets that researchers cross-reference with session duration and hand outcomes. Studies from institutions like teh University of Melbourne show that cursor velocity tends to drop when participants face repeated decisions involving medium to large pots after four or more hours of continuous play.
Software developers integrate these metrics into monitoring tools that flag sequences where rapid cursor adjustments precede unusually conservative or oversized bets. Observers note that such patterns emerge most clearly in ring games because the continuous nature of cash play allows for sustained tracking without the structural breaks found in tournaments. As of June 2026 several major sites have begun testing these combined data streams to provide optional session summaries that highlight potential focus shifts without revealing individual hand details.
Data Collection Methods in Virtual Cash Games
Tracking begins the moment a player joins a table and continues through each street of every hand. Timestamps record the exact moment cursor speed changes relative to the appearance of pot size information on screen, while additional fields capture bet amounts and decision latency. Research teams at institutions across North America and Europe have compiled thousands of hours of anonymized logs that reveal consistent correlations between velocity drops and subsequent deviations from established betting patterns. These datasets come from voluntary participant studies rather than platform mandates, yet they provide enough volume for statistical modeling of concentration indicators.
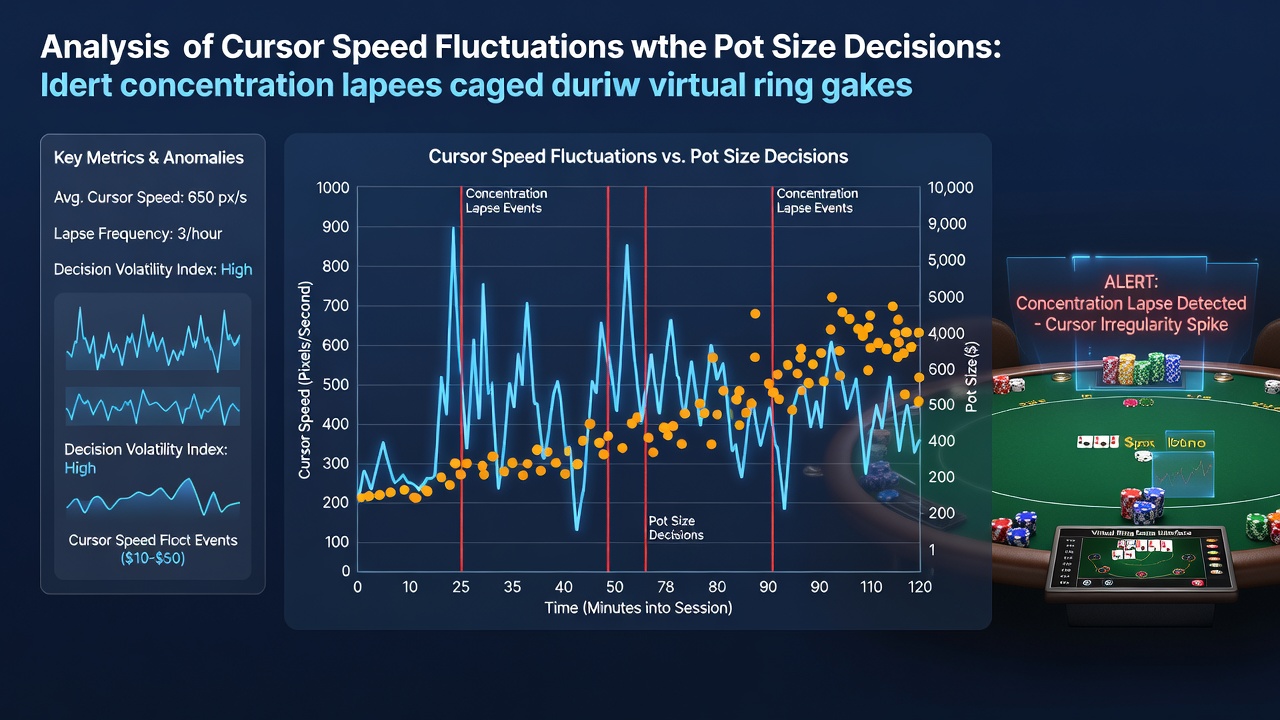
Correlation Patterns Between Movement Speed and Bet Sizing
Analysts plot cursor pixels per second against normalized pot sizes to identify clusters where slower movement coincides with larger or smaller than expected wagers. Figures from academic reviews indicate that velocity reductions of twenty percent or more often precede bets that fall outside a player's historical range for similar stack depths and position. Such alignments appear more frequently after the three-hour mark in sessions lasting six hours or longer, according to aggregated reports compiled by gaming technology research groups in Australia and Canada. The mapping process uses regression models that treat pot size as the dependent variable while cursor speed serves as one of several predictor inputs alongside time of day and prior hand frequency.
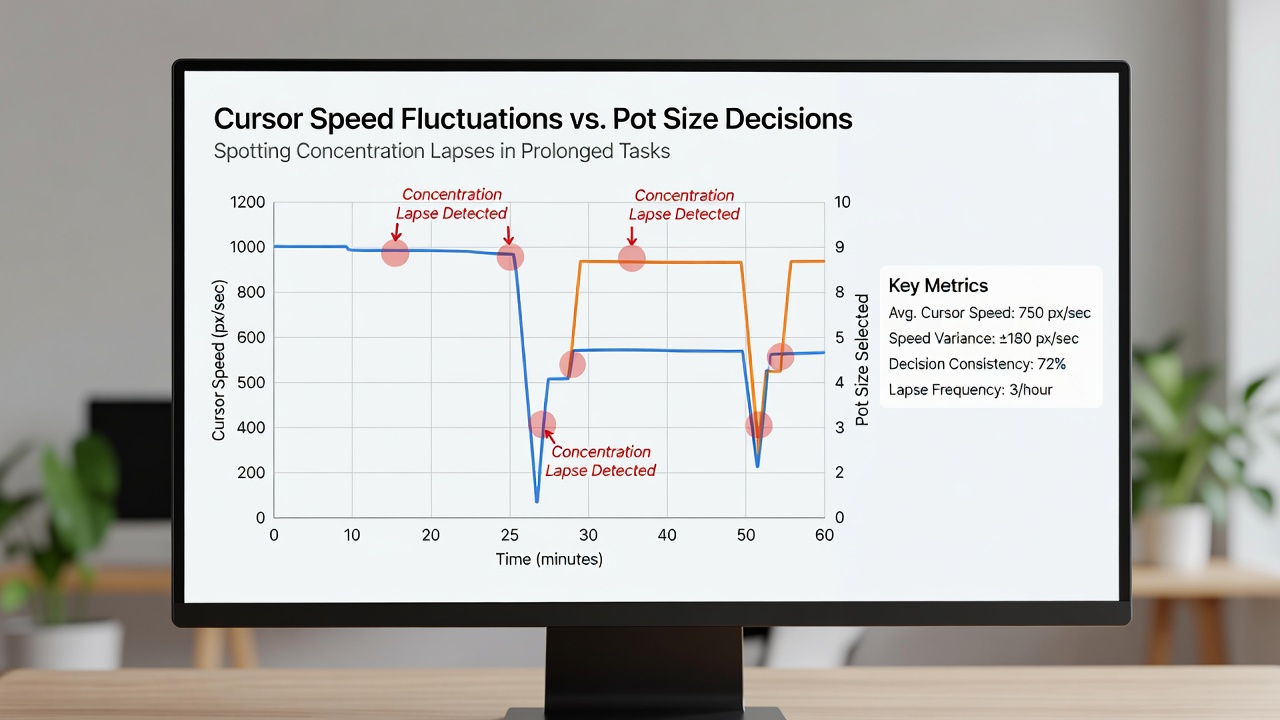
Identifying Lapses Through Combined Metrics
Single metrics rarely suffice, so teams combine cursor data with decision timing and bet sizing deviations to generate lapse probability scores. When cursor speed stabilizes at a lower baseline while pot size selections become more erratic, the combined signal strengthens. Reports from the Canadian Centre for Gaming Research describe how these composite indicators have been validated against self-reported fatigue surveys collected at regular intervals during controlled observation periods. The approach avoids direct inference about mental states and instead focuses on observable behavioral shifts that repeat across large sample sizes.
Platform Implementation and Reporting Tools
Developers embed the analysis modules as optional overlays that display summary heat maps rather than real-time alerts. Players who enable the feature receive post-session breakdowns that list time windows where cursor and betting patterns diverged most noticeably. Industry documentation from European gaming technology associations notes that these tools operate entirely on local client data before any optional upload to cloud analytics services. Integration remains limited to cash game tables because tournament structures introduce variable stack pressures that complicate direct comparisons across different event formats.
Future Refinements and Cross-Regional Studies
Additional variables under examination include screen resolution effects on cursor calibration and the influence of multi-table layouts on movement consistency. Collaborative projects between Australian and Scandinavian research centers continue to expand the geographic diversity of logged sessions to test whether regional differences in average session length affect the observed correlations. These efforts rely on standardized data schemas that allow comparison without exposing proprietary platform algorithms.
Conclusion
The mapping of cursor speed fluctuations against pot size decisions supplies one measurable dimension for examining sustained attention during extended virtual ring game play. Continued refinement of these techniques depends on larger anonymized datasets and consistent validation against independent performance indicators. As platforms evolve their logging capabilities through 2026, the resulting insights remain grounded in observable action sequences rather than interpretive claims about player psychology.